Visual Analysis of Spatial Variability and Global Correlations in Ensembles of Iso-Contours
Florian Ferstl, Mathias Kanzler, Marc Rautenhaus, Rüdiger Westermann
Technische Universität München, Germany
Abstract
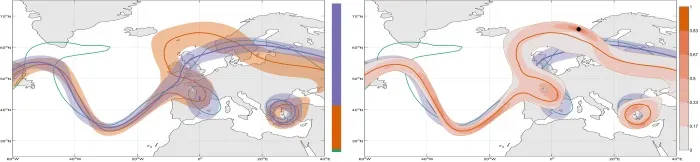
For an ensemble of iso-contours in multi-dimensional scalar fields, we present new methods to a) visualize their dominant spatial patterns of variability, and b) to compute the conditional probability of the occurrence of a contour at one location given the occurrence at some other location. We first show how to derive a statistical model describing the contour variability, by representing the contours implicitly via signed distance functions and clustering similar functions in a reduced order space. We show that the spatial patterns of the ensemble can then be derived by analytically transforming the boundaries of a confidence interval computed from each cluster into the spatial domain. Furthermore, we introduce a mathematical basis for computing correlations between the occurrences of iso-contours at different locations. We show that the computation of these correlations can be posed in the reduced order space as an integration problem over a region bounded by four hyper-planes. To visualize the derived statistical properties we employ a variant of variability plots for streamlines, now including the color coding of probabilities of joint contour occurrences. We demonstrate the use of the proposed techniques for ensemble exploration in a number of 2D and 3D examples, using artificial and meteorological data sets.
Associated publications
Visual Analysis of Spatial Variability and Global Correlations in Ensembles of Iso-Contours,
F. Ferstl, M. Kanzler, M. Rautenhaus, R. Westermann,
Computer Graphics Forum, 35: 221–230 (EuroVis 2016) [PDF] [SUPPLEMENTARY MATERIAL] [BIBTEX]