Funded by the European Research Council: ERC Advanced Grant 2011
Principal Investigator: Rüdiger Westermann
Host Institution: Technical University of Munich
SaferVis - Uncertainty Visualization for Reliable Data Discovery
Visualization has significantly changed the way humans analyse large amounts of multi-dimensional data. However, current visualization techniques can give only little or no guarantees regarding the confidence in the displayed information. Since this information is always affected by uncertainties in the data generation processes, the user can be lead to misclassifications, misinterpretations, and false assumptions.
In the ERC Advanced Grant “SaferVis” we have challenged the status quo in visual data analysis with innovative ideas for next-generation technology that provides uncertainty visualization as a core methodology. We have developed visualization techniques for the communication of the variability of features in uncertain data, by deriving probability distributions for their occurrence using stochastic uncertainty models or ensembles of feature representations.
Besides changing the way visual data exploration is performed, research in uncertainty visualization has the potential to strongly influence the way scientific measurements and computer simulations are carried out. The precise knowledge of uncertainties enables to discover quantitatively the data generation process, and it can, therefore, be used to quantify the sensitivity of a process and the generated results to the choice of parameterization over the input parameters. Hence, it is our vision to position uncertainty visualization as a mandatory technology for guiding research towards the most reliable data generation process within a given uncertainty tolerance.
In the implementation of the research project we have followed a three-stage strategy: In the first period, the PhD students have pursued mostly independent research, advised by PI Westermann and the PostDocs, to become familiar with the field, the research problems, the available solutions, and to develop new solutions for specific problems. In the second period, in addition to pursuing independent research, we have tried to bring the research of the PhD students and PostDocs closer together, with the goal to pursue targeted collaborative research and, thus, to create mutual benefits and increase the overall project outcome. In the third period, we have extensified our efforts to pursue collaborative research, and we have tried to combine the expertise of the single researchers in teams. This strategy turned out to be very successful, which is demonstrated by publications where 3-5 SaferVis researchers appear as co-authors.
In particular, we have pursued research in the following areas of uncertainty visualization:
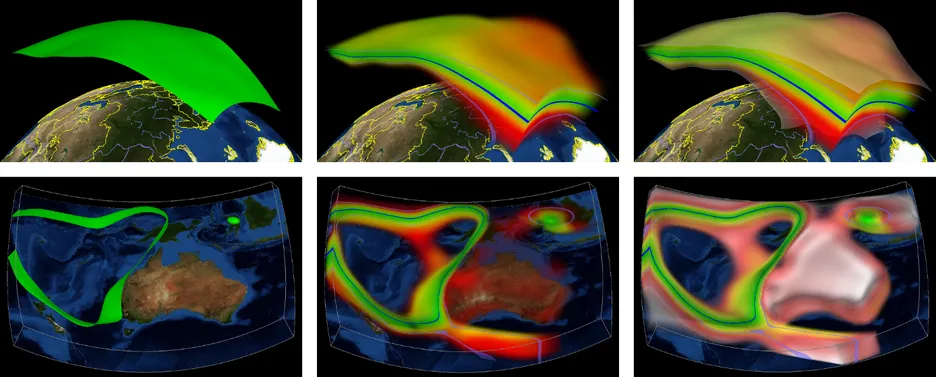
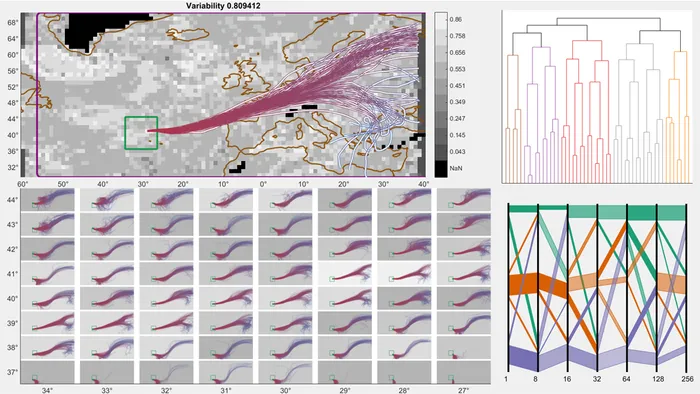
Uncertainty models and probabilistic feature analysis: In our research we have analysed the uncertainty of specific features like iso-contours in scalar fields and characteristic lines in vector fields. Here we have used both parametric and non-parametric stochastic uncertainty models, based on Gaussian distributions and kernel density estimates. We have further developed new methods to support statistics-based visualizations of 3D scalar ensemble fields, using correlation analysis and shape clustering. A very promising new approach is the analysis of feature probabilities from ensembles of scalar and vector fields using reduced model representations and clustering in the resulting high-dimensional feature space.
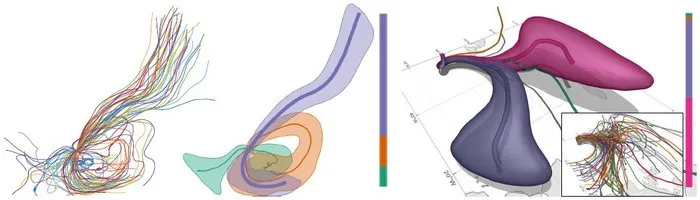
Visual variability mapping: We have developed glyph-based depictions for distributions of directional quantities, multi-dimensional confidence envelopes for ensembles of shapes, and variability plots including correlation information for trajectories in ensemble flow fields and contours in scalar fields. For the first time we have addressed the visualization of the spatio-temporal evolution of specific features in ensemble fields, and we have started to address new approaches to visualize the uncertainty that is present in particle-based ensemble data.
Computational steering: We have further improved our high-performance simulation framework for generating ensembles of fluids and deformable bodies. Therefore, we have pursued research on realtime finite-element and finite-difference simulations of elastic bodies. We have considerably improved the efficiency of numerical multigrid schemes in situations with complicated boundaries, by a combination of adaptively refined hexahedral elements and cell duplication. GPU support enables the interactive change of input model parameters to generate ensembles of numerical simulations, and to instantly analyse the resulting variations of the simulation results. Some of these ensembles have been used in publications on uncertainty visualization. We have further extended our research to examine the sensitivity of topology optimization to different input parameter settings. A report on uncertainty quantification in topology optimization is under development.
Meteorological ensemble visualization: In the scope of SaferVis, we have focused especially on the development of novel concepts and algorithms for analysing the uncertainty that is represented by an ensemble of simulations of a physical phenomenon, such as ensemble weather forecasts. Instead of making a single deterministic computation of the future weather state, today the weather centres worldwide compute ensembles of numerical forecasts routinely using operational ensemble prediction systems. Weather forecasts then take the form of probabilities of occurrence of weather events, which are derived from the ensemble fields.

SaferVis and beyond
Ensemble analysis becomes more and more important for the weather centres, because due to the chaotic nature of the atmosphere some weather situations are hard to predict. This occasionally results in situations where forecast skills drop and forecasts become wrong. This particular problem is of great societal and economic importance since these are the forecasts that are most often used by decision makers, and which can help saving human life and billions of Euro.
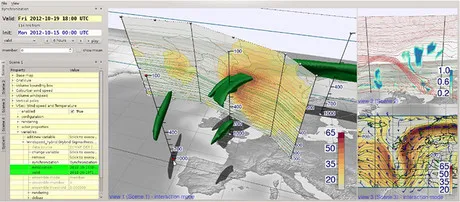
In the scope of SaferVis we have developed the opensource software tool Met3D for 3D meteorological ensemble visualization. Met3D aims at supporting ensemble-based weather forecasting, meteorological research as well as teaching activities. Met.3D uses modern graphics technology to achieve interactive 3D visualization on standard consumer hardware. It supports forecast data from the European Centre for Medium Range Weather Forecasts (ECMWF) and can operate directly on ECMWF hybrid level grids.
In 2015 and strongly building upon our research on uncertainty visualization in SaferVis, we have taken part in the proposal for the German national collaborative research centre „waves2weather“ on meteorological science. The proposal (with leading group of meteorologist Prof. Craig, University Mainz and KIT Karlsruhe) was accepted for funding, and we are now taking part in two sub-projects related to the visualization of uncertainty and sensitivity in meteorological dynamics simulations.
Building upon SaferVis I have also successful applied for an ERC PoC grant in 2017. Here we investigate the potential of the visualization software Met.3D for an operational use at weather centres like ECMWF and Germany's National Meteorological Service (DWD) and for training forecasters, decision makers and researchers in 3D uncertainty visualization. Furthermore we examine the possible societal impact of (3D) ensemble visualization for communicating uncertainty in forecasts of high impact weather events to the public.
In summary, the ERC funded Advanced Grant SaferVis has opened up new means to analyse the uncertainty that is present in scientific data, and it has paved the way for a number of research project in uncertainty visualization and even the integration of uncertainty visualization into data generation processes.
Acknowledgements
We would like to thank the European Research Council for the generous financial support of our research in uncertainty visualization. We are confident that we could make significant progress in this field, both with regard to the development of new methods and their use in real-world applications like meteorology, seismology and fluid mechanics. We also would like to thank our EU officer Regine Galas for her support and smooth handling of the project. The same holds for the human resource and financial officers at TUM, which helped us a lot in the preparation of the periodical financial reports.
Publications
A list of publications that have been resulted from our ERC funded research in uncertainty visualization can be found here:
- Visualizing the Positional and Geometrical Variability of Isosurfaces in Uncertain Scalar Fields
- Visualization of Global Correlation Structures in Uncertain 2D Scalar Fields
- Correlation Visualization for Structural Uncertainty Analysis
- A Custom Implementation for Visualizing Sub-surface 3D Scalar Fields in GPlates
- Visualizing 3D Mantle Structure from Seismic Tomography and Geodynamic Model Predictions of the India-Eurasia and East Asia Convergence Zone
- Visualizing Contour Distributions in 2D Ensemble Data
- Visualizing the Variability of Gradients in Uncertain 2D Scalar Fields
- Progressive High-Quality Response Surfaces for Visually Guided Sensitivity Analysis
- Interactive 3D visualization of ECMWF ensemble forecasts for research flight planning
- Large-Scale Liquid Simulation on Adaptive Hexahedral Grids
- Visualizing the Stability of Critical Points in Uncertain Scalar Fields
- Multi-Charts for Comparative 3D Ensemble Visualization
- Analyzing the Effect of Lossy Compression on Particle Traces in Turbulent Vector Fields
- Comparative Visual Analysis of Vector Field Ensembles
- Streamline Variability Plots for Characterizing the Uncertainty in Vector Field Ensembles
- Vector-to-Closest-Point Octree for Surface Ray-Casting
- Three-dimensional visualization of ensemble weather forecasts – Part 2: Forecasting warm conveyor belt situations for aircraft-based field campaigns
- Three-dimensional visualization of ensemble weather forecasts – Part 1: The visualization tool Met.3D (version 1.0)
- A System for High-Resolution Topology Optimization
- Solving the Fluid Pressure Poisson Equation Using Multigrid—Evaluation and Improvements
- Screen-space Silhouettes for Visualizing Ensembles of 3D Isosurfaces
- Comparative Visual Analysis of Transport Variability in Flow Ensembles
- Visual Analysis of Spatial Variability and Global Correlations in Ensembles of Iso-Contours
- Time-hierarchical Clustering and Visualization of Weather Forecast Ensembles
- Line density control in screen-space via balanced line hierarchies
- Visualizing the Central Tendency of Ensembles of Shapes