Visual analysis of model parameter sensitivities along warm conveyor belt trajectories using Met.3D (1.6.0-multivar1)
Christoph Neuhauser1, Maicon Hieronymus2, Michael Kern3, Marc Rautenhaus4, Annika Oertel5, Rüdiger Westermann1
1 Chair of Computer Graphics and Visualization, Technical University of Munich, Germany
2 Institute of Computer Science, Johannes Gutenberg University, Mainz, Germany
3 Advanced Micro Devices GmbH, Germany
4 Visual Data Analysis Group, Regional Computing Centre, University of Hamburg, Germany
5 Institute of Meteorology and Climate Research, Karlsruhe Institute of Technology, Germany
Abstract
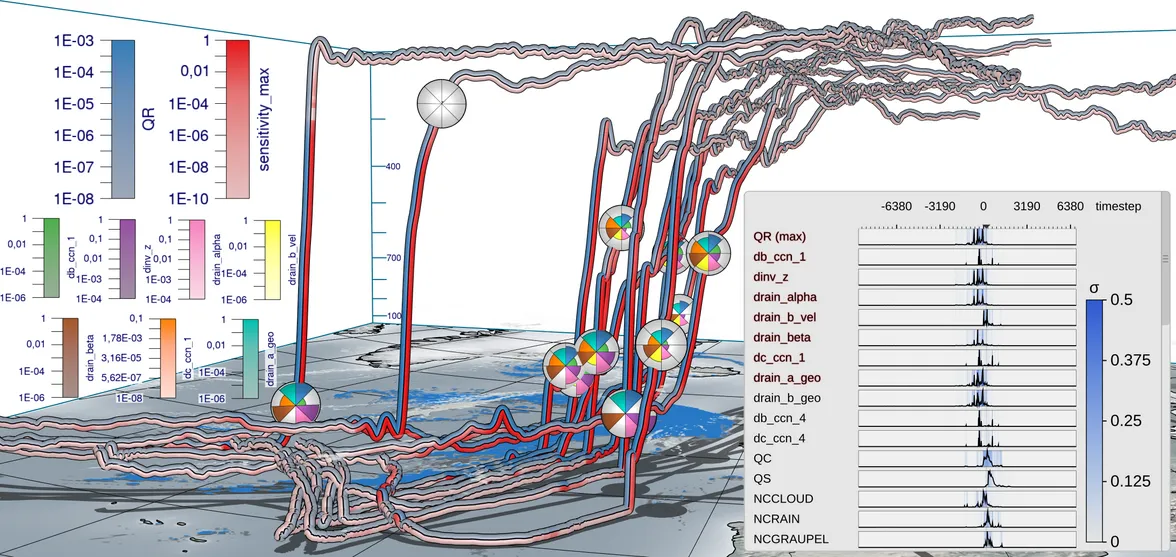
Numerical weather prediction models rely on parameterizations for subgrid-scale processes, e.g., for cloud microphysics, which are a well-known source of uncertainty in weather forecasts. Via algorithmic differentiation, which computes the sensitivities of prognostic variables to changes in model parameters, these uncertainties can be quantified. In this article, we present visual analytics solutions to analyze interactively the sensitivities of a selected prognostic variable to multiple model parameters along strongly ascending trajectories, so-called warm conveyor belt (WCB) trajectories. We propose a visual interface that enables us to (a) compare the values of multiple sensitivities at a single time step on multiple trajectories, (b) assess the spatiotemporal relationships between sensitivities and the trajectories' shapes and locations, and (c) find similarities in the temporal development of sensitivities along multiple trajectories. We demonstrate how our approach enables atmospheric scientists to interactively analyze the uncertainty in the microphysical parameterizations and along the trajectories with respect to the selected prognostic variable. We apply our approach to the analysis of WCB trajectories within extratropical Cyclone Vladiana, which occurred between 22–25 September 2016 over the North Atlantic. Peaks of sensitivities that occur at different times relative to a trajectory's fastest ascent reveal that trajectories with their fastest ascent in the north are more susceptible to rain sedimentation from above than trajectories that ascend further south. In contrast, large sensitivities to cloud condensation nuclei (CCN) activation and cloud droplet collision in the south indicate a local rain droplet formation. These large sensitivities reveal considerable uncertainty in the shape of clouds and subsequent rainfall. Sensitivities to cloud droplets' formation and subsequent conversion to rain droplets are also more pronounced along convective ascending trajectories than for slantwise ascents. The slantwise ascending trajectories are characterized by periods of slower ascent and even descent, during which the sensitivities to the formation of cloud droplets and rain droplets alternate. This alternating pattern leads to large-scale precipitation patterns, whereas convective ascending trajectories do not exhibit this pattern. Thus the primary source for uncertainty in large-scale precipitation patterns stems from slantwise ascents. The strong ascent of convective trajectories leads to large sensitivities of rain mass density to riming and freezing parameters at high altitudes, which are barely present in slantwise ascending trajectories. These sensitivities correspond to uncertainties concerning graupel and hail formation in convective ascents.
Associated publications
Visual analysis of model parameter sensitivities along warm conveyor belt trajectories using Met.3D (1.6.0-multivar1)
Christoph Neuhauser, Maicon Hieronymus, Michael Kern, Marc Rautenhaus, Annika Oertel, Rüdiger Westermann
Geoscientific Model Development (GMD), 2023
[PDF] [Video] [Code] [BIB]