A Custom Implementation for Visualizing Sub-surface 3D Scalar Fields in GPlates
Tobias Pfaffelmoser1, John Cannon2
1Computer Graphics and Visualization Group, Technische Universität München, Germany
2EarthByte Group, School of Geosciences, The University of Sydney, NSW 2006, Australia
Background
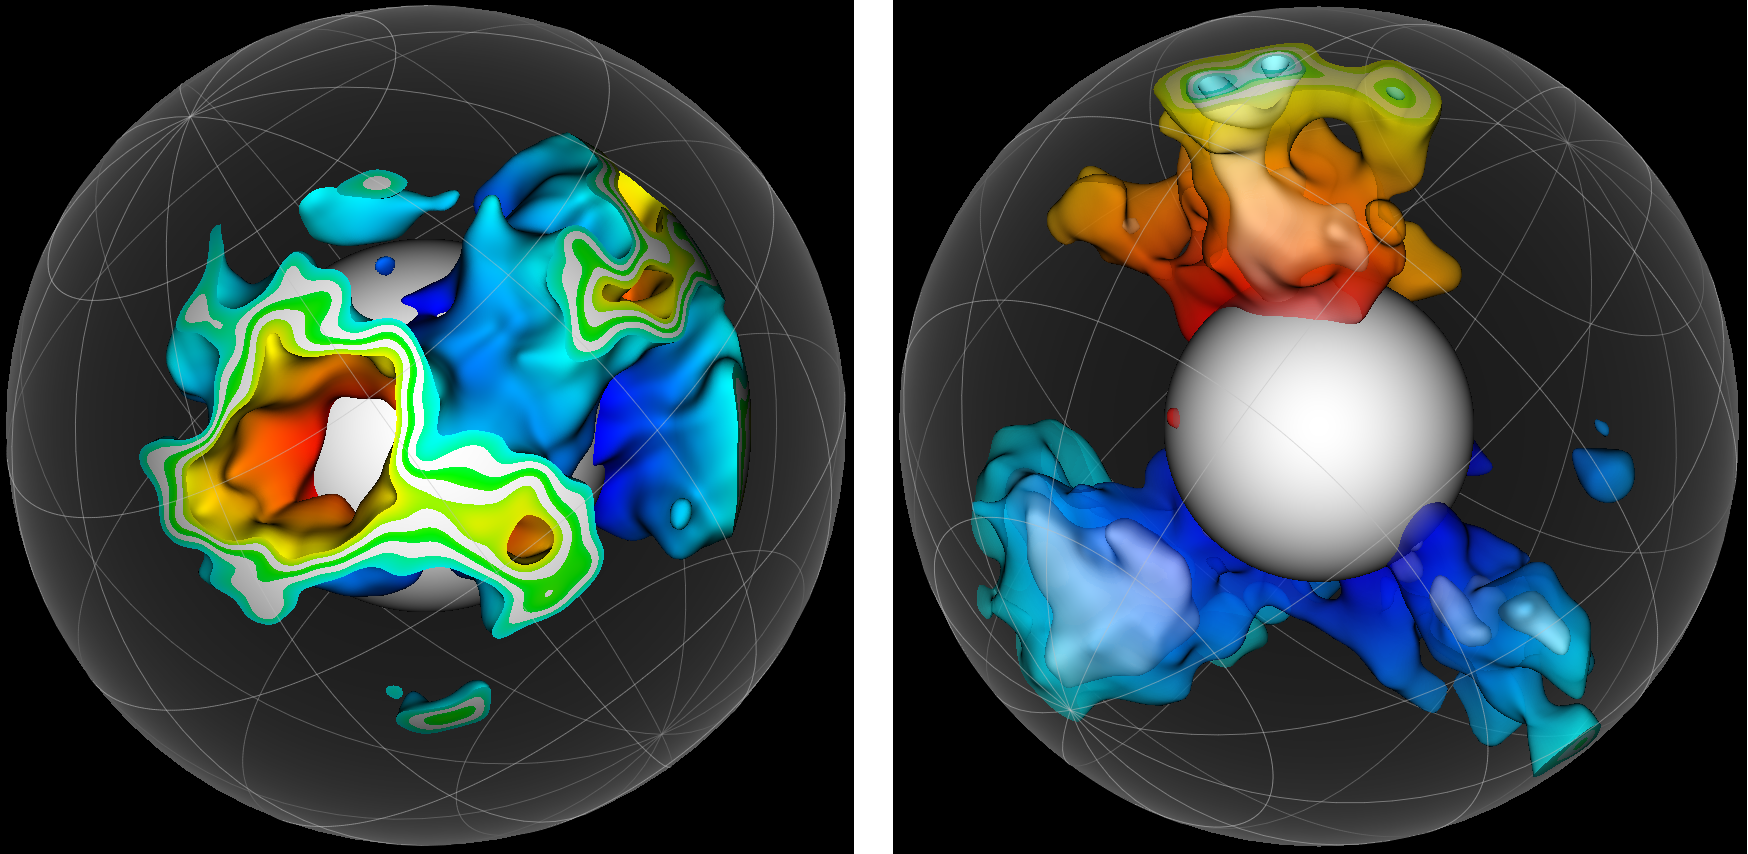
The ability to visualize sub-surface 3D scalar fields together with traditional geological surface data enables researchers to observe their relationship through geological time in a common plate tectonic reference frame. This is useful in a variety of geoscience scenarios including the visualization of geodynamic simulations in relation to their plate tectonic surface constraints and visualizing 2D cross-sections of sub-surface data along relevant reconstructed geological surface lines. To achieve this, a custom volume rendering solution has been designed for the GPlates software application and implemented as a prototype using the platform-independent OpenGL Shading Language. The existing GPlates hierarchical cube map framework (for surface raster data) has been extended to support sub-surface 3D scalar fields. For the Earth’s sub-surface, the cube map structure improves performance over tetrahedral-based structures due to a simpler, more efficient method of retrieving and interpolating 3D scalar data during ray-tracing traversal. This enables interactive visualization on modern desktop Graphics Processing Units (GPUs). In addition, the common cube map framework (linking surface and sub-surface data) enables detailed surface fill regions (such as tectonic plates) to mask the visualization of the underlying sub-surface data. In the future we plan to support: 2D cross-sections formed from depth-projected surface lines; time sequences of 3D scalar fields (to visualize sub-surface evolution); and reconstruction of present day scalar fields to geological times (in a manner similar to surface raster tectonic reconstruction). We also plan to support rendering of datasets on both local desktop GPUs and cluster High Performance Computing (HPC) visualization systems, dependent on the dataset size.
The GPlates software framework with 3D functionality can be found at www.gplates.org.
Associated Conference Presentations
A Custom Implementation for Visualizing Sub-surface 3D Scalar Fields in GPlates
T. Pfaffelmoser, J. Cannon, 34th International Geological Congress [Download]