Visual Analysis of the Temporal Evolution of Ensemble Forecast Sensitivities
Alexander Kumpf, Marc Rautenhaus, Michael Riemer*, and Rüdiger Westermann
Department of Informatics, Technische Universität München, Germany
*Institute of Atmospheric Physics, Johannes Gutenberg Universität Mainz, Germany
Abstract
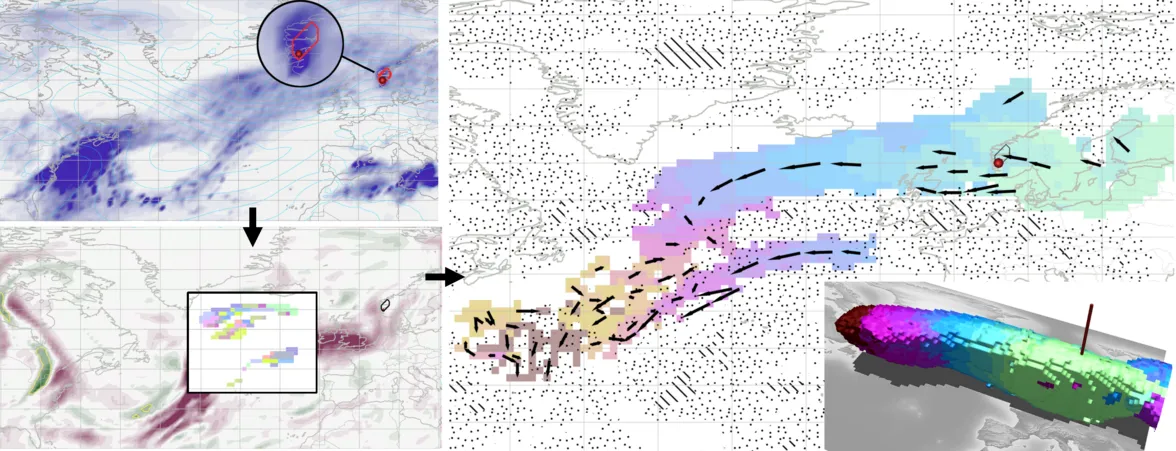
Ensemble sensitivity analysis (ESA) has been established in the atmospheric sciences as a correlation-based approach to determine the sensitivity of a scalar forecast quantity computed by a numerical weather prediction model to changes in another model variable at a different model state. Its applications include determining the origin of forecast errors and placing targeted observations to improve future forecasts. We—a team of visualization scientists and meteorologists—present a visual analysis framework to improve upon current practice of ESA. We support the user in selecting regions to compute a meaningful target forecast quantity by embedding correlation-based grid-point clustering to obtain statistically coherent regions. The evolution of sensitivity features computed via ESA are then traced through time, by integrating a quantitative measure of feature matching into optical-flow-based feature assignment, and displayed by means of a swipe-path showing the geo-spatial evolution of the sensitivities. Visualization of the internal correlation structure of computed features guides the user towards those features robustly predicting a certain weather event. We demonstrate the use of our method by application to real-world 2D and 3D cases that occurred during the 2016 NAWDEX field campaign, showing the interactive generation of hypothesis chains to explore how atmospheric processes sensitive to each other are interrelated.
Associated publications
Visual Analysis of the Temporal Evolution of Ensemble Forecast Sensitivities
Alexander Kumpf, Marc Rautenhaus, Michael Riemer, and Rüdiger Westermann
IEEE Transactions on Visualization and Computer Graphics 2019 (Proc. IEEE VAST 2018) [PDF] [VIDEO][BIBTEX]