Multi-Charts for Comparative 3D Ensemble Visualization
Ismail Demir, Christian Dick, Rüdiger Westermann
Computer Graphics and Visualization Group, Technische Universität München, Germany
Background
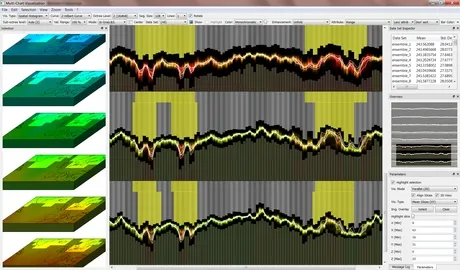
A comparative visualization of multiple volume data sets is challenging due to the inherent occlusion effects, yet it is important to effectively reveal uncertainties, correlations and reliable trends in 3D ensemble fields. In this paper we present bidirectional linking of multi-charts and volume visualization as a means to analyze visually 3D scalar ensemble fields at the data level. Multi-charts are an extension of conventional bar and line charts: They linearize the 3D data points along a space-filling curve and draw them as multiple charts in the same plot area. The bar charts encode statistical information on ensemble members, such as histograms and probability densities, and line charts are overlayed to allow comparing members against the ensemble. Alternative linearizations based on histogram similarities or ensemble variation allow clustering of spatial locations depending on data distribution. Multi-charts organize the data at multiple scales to quickly provide overviews and enable users to select regions exhibiting interesting behavior interactively. They are further put into a spatial context by allowing the user to brush or query value intervals and specific distributions, and to simultaneously visualize the corresponding spatial points via volume rendering. By providing a picking mechanism in 3D and instantly highlighting the corresponding data points in the chart, the user can go back and forth between the abstract and the 3D view to focus the analysis.
Acknowledgment
Access to ECMWF prediction data has been kindly provided in the context of the ECMWF special project "Support Tool for HALO Missions". We are grateful to the special project members Marc Rautenhaus and Andreas Dörnbrack for providing the ECMWF ENS dataset of 17 October 2012. We would like to thank Jens Jasche and Torsten Enßlin from the Max-Planck-Institute for Astrophysics for providing the galaxy ensemble.
This work was supported by the European Union under the ERC Advanced Grant 291372 SaferVis - Uncertainty Visualization for Reliable Data Discovery.