Visualizing Contour Distributions in 2D Ensemble Data
Tobias Pfaffelmoser, Rüdiger Westermann
Computer Graphics and Visualization Group, Technische Universität München, Germany
Background
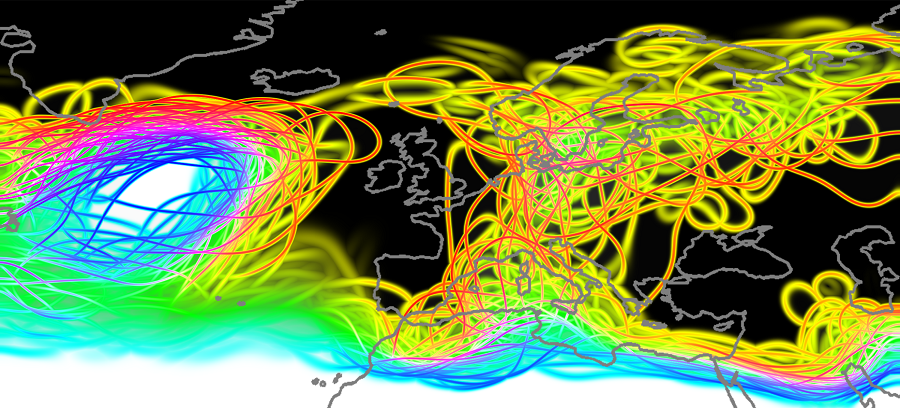
Overlaid plots of iso-contours in individual members of a scalar ensemble field are a popular concept to visualize the data uncertainty. However, such plots do not allow inferring on the spatial cumulative probability distribution of the iso-contours, and they cannot reveal distribution characteristics like spread and topology for very large amounts of contours. In this paper, we propose a new visualization technique for iso-contours in ensemble data sets to overcome these limitations. Our technique makes no assumption about a stochastic uncertainty model, rendering it suitable for arbitrary ensemble distributions. It computes a statistical summary of the ensemble over the spatial domain, including probability density values for arbitrary domain points. From this information, the uncertainty and topology of iso-contours can be determined, as well as the variations in gradient magnitude around these contours. Since the visualization is carried out on the GPU, our approach allows analyzing even very large ensemble data sets at interactive rates.
A preprint of the article is available for download below. The definitive version is available at http://diglib.eg.org.
Associated Publications
Visualizing Contour Distributions in 2D Ensemble Data
T. Pfaffelmoser, R. Westermann, EuroVis-Short Papers [Download] [Bibtex]